Scanning Big Networks - Evasion, Automation and Visualization
Advanced topics on network, host and port identification with defense evasion, automation of the scanning and results visualization.
Introduction
Hi! Today I want to continue sharing my notes on scanning enterprise networks.
At part 1 we did review the basics for optimizing our scanning techniques to get better results for less time. At part 2 I will try to highlight more specific tasks like facing the defense solutions and upgrading the processing of the results.
Defense Evasion
While doing the scanning, we might face a various defense solutions, like IPS and NGFW. These solutions can monitor the network traffic, or collect statistics from endpoints. They may highlight amount of network connections from one source host and scan for malicious signatures, for example. Then they do make a decision about alerting for suspicious activity or even banning the hosts IP-address for a while.
In this section, we will review various methods to evade these defense solutions. But it have to note that we must pay for it with our time or our results of the scan.
Care about interfaces
Assume you have a several network interfaces available on your device. You will have a default routing tables for your gateways unless you explicitly configured the routes. This means that several routes from different interfaces can interfere with each other, especially while working with several VPN connections.
In this situation you can lose the results, scan the wrong target or even expose yourself for the defenders. That’s why it is important to specify the target network interface in your tools if you are not sure about it.
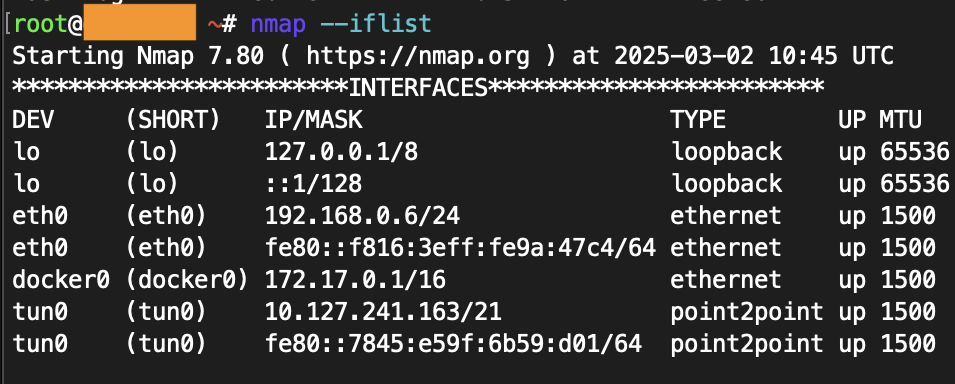
For example with nmap, the target interface can be specified with -e option. You can also show available interfaces right in nmap with --iflist flag.
1
2
nmap --iflist
nmap -e eth0 ...
Scanning speed
One of the first metrics for network defense solutions may be a speed and amount of connections from one
nmap’s -T2 template makes nmap do a Polite scan with minimum scan delay of 400ms and maximum of 1000ms and disables parallelism entirely. But also it sets max-retries value to 10 and port timeout value to 10 seconds, which is unnecessary in my opinion. We will reduce these settings with explicit specification to reduce the time of scanning. We can also setup the exact scan delay with --scan-delay Nms option.
You can see an example of slow scanning for top 1000 ports below. Note that this scan will be done in approximately 4 hours for 16 hosts.
1
sudo nmap -n -Pn -g 53 -sS -T2 --max-rtt-timeout 500ms —-max-retries 0 --min-hostgroup 16 —-stats-every 10m -oA top1000_scope -iL scope.txt
After the port scanning is done, we can grep opened ports and then specify them in our service scanning.
1
2
cat *.nmap | grep -E '(open|closed|filtered)' | grep -v 'Not shown' | cut -d '/' -f1 | sort -u | tr '\n' ',' | rev | cut -c2- | rev > ports.txt
sudo nmap -sS -T2 —-max-rtt-timeout 500ms -—max-retries 1 -—stats-every 10m -n -Pn -g 53 -p $(cat ports.txt) -oA sc_sv_scope -sC -sV -iL ips.txt
We can also apply the same logic for our ping scan. The max-retries value is set to 1 because it is frequent to lose first ping request in enterprise networks, just in my experience.
1
sudo nmap -PE -sn -n -T2 -—min-hostgroup 8192 -—max-retries 1 -—max-rtt-timeout 1000ms -oA ping_10.10.10.0_24 10.10.10.0/24
Idle scanning
Another option to evade speed scanning alerts is to hide or shuffle our source host IP-address. We can perform this in local network with Idle Scan technique. Or we may have take over several machines in the network and distribute the scanning to them, for example.
Nmap’s IP ID Idle scanning allows us to be a little stealthy scanning a target while spoofing the IP address of another host on the network.
In order for this type of scan to work, we will need to locate a host that is idle on the network and uses IP ID sequences of either Incremental or Broken Little-Endian Incremental. Metasploit contains the module scanner/ip/ipidseq to scan and look for a host that fits the requirements.
Use some host as zombie to scan the host with command below:
1
nmap -Pn -sI 192.168.1.109 192.168.1.114
You can read more about Idle Scan at nmap’s idle scan documentation.
Hosts order
By default, nmap takes an order of scanned hosts from us. This means that is walk consistently in our list of targets or specified network in terminal. Some intrusion detection and prevention systems may pay attention for the order of hosts we interact with. They may recognize that attempt to connect to port 80 on host 10.10.10.1, then 10.10.10.2 and then 10.10.10.3 is suspicious if they have an enough access to these systems or they do sniff a network traffic.
We can try to bypass this checks with --randomize-hosts option. It tells Nmap to shuffle each group of up to 16384 hosts before it scans them. This can make the scans less obvious to various network monitoring systems, especially when you combine it with slow timing options.
An alternative solution is to generate the target IP list with a list scan and randomize it with a script, then provide the whole list to Nmap with -iL.
1
nmap --randomize-hosts -iL scope.txt
Source port number
According to nmap documentation:
One surprisingly common misconfiguration is to trust traffic based only on the source port number. It is easy to understand how this comes about. An administrator will set up a shiny new firewall, only to be flooded with complaints from ungrateful users whose applications stopped working.
I would say that it is possible to find that network is configured to explicitly trust everything from the exact port number, like DNS port 53 or FTP active connection port 20. We can abuse this to evade defense solutions by specifying the source port number in our scanning tools. But it also could be a bad practice for us, because of abnormal HTTP requests from DNS server port.
Nmap offers the -g and --source-port options (they are equivalent) to exploit these weaknesses. Simply provide a port number and Nmap will send packets from that port where possible.
1
sudo nmap -g 53 10.10.10.10
Service bruteforce
It worth noting that service bruteforce is a really bad practice in case of facing defense solution. Nmap’s service signatures are well-documented and security vendors use them to ban potential threats even at --version-intensity 0 level.
The easy solution here is to not use the version detection options entirely, and test interesting port numbers manually. We can specify the http-title and ssl-cert script because they make valid connections and requests if properly configured.
The hard solution here is to review the service detection database and try to identify potential signatures, that could be used by security vendors. We will review an example of nmap’s hard-coded signature in the next section.
Signatures
Be aware of defense systems in the target perimeter, like IPS or NGFW. These solutions will identify and ban common scanning signatures, like several ones for nmap.
For example, nmap scripting engine has a default HTTP User-Agent field, which is sent if not changed explicitly. A lot of security solutions will identify these header and drop the request or ban the sender for some time.
To prevent nmap to use this User-Agent you can specify your one with --script-args http.useragent=User-Agent option. You can also setup an alias for your terminal to persist this setting.
But, in my opinion, a more cool way to remove this signatures is to fork the nmap and change the User-Agent field by default. This will prevent you to make common human mistakes, which could crash the entire operation.
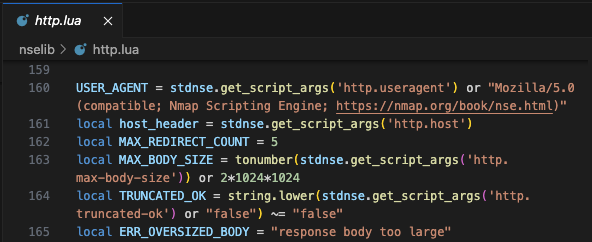
The path to change the nmap HTTP User-Agent in the main repo is nselib/http.lua. Change the field to something like default Chrome for Windows 10 user-agent. This will decrease the rate of detection by a lot.
1
USER_AGENT = stdnse.get_script_args('http.useragent') or "Mozilla/5.0 (Windows NT 10.0; Win64; x64) AppleWebKit/537.36 (KHTML, like Gecko) Chrome/131.0.0.0 Safari/537.36"
You can search for other nmap signatures and change them in your own version of nmap. For example, nmap has a default set of HTTP requests when performing the service scan. These requests paths are not randomized and can be used in signatures. So, their can be changed too. I’ll leave that for the reader to explore further.
Automation
We’ve reviewed several methods to optimize our scanning. Now we can think about how to automate this processes to get the clearest results possible for given amount of time. At this section we will review some scripts and tools to get the highest scanning surface or get the fastest results as possible.
Find hosts by opened port
One of the most basic tasks here is to quickly scan the network to identify available hosts by scanning only one port. I wrote a script to automate the configuration and pass just a list of targets and the target port into the script. You can find it in my GitHub repository
1
2
3
4
5
6
7
nmap -iL "$1" -p "$2" --open -Pn -n \
    --min-hostgroup 4096 \
    --max-retries 2 \
    --max-rtt-timeout 500ms 2>/dev/null \
    --min-rate 200 \
    | grep "Nmap scan report for" \
    | cut -d " " -f5
HackTheBox-like scanning
In case of doing labs like HackTheBox I always want to get the full results of the network scanning to be sure that nothing is missed. I also use that when I’m sure that the target host is very important and I want to be sure that everything is checked during the work.
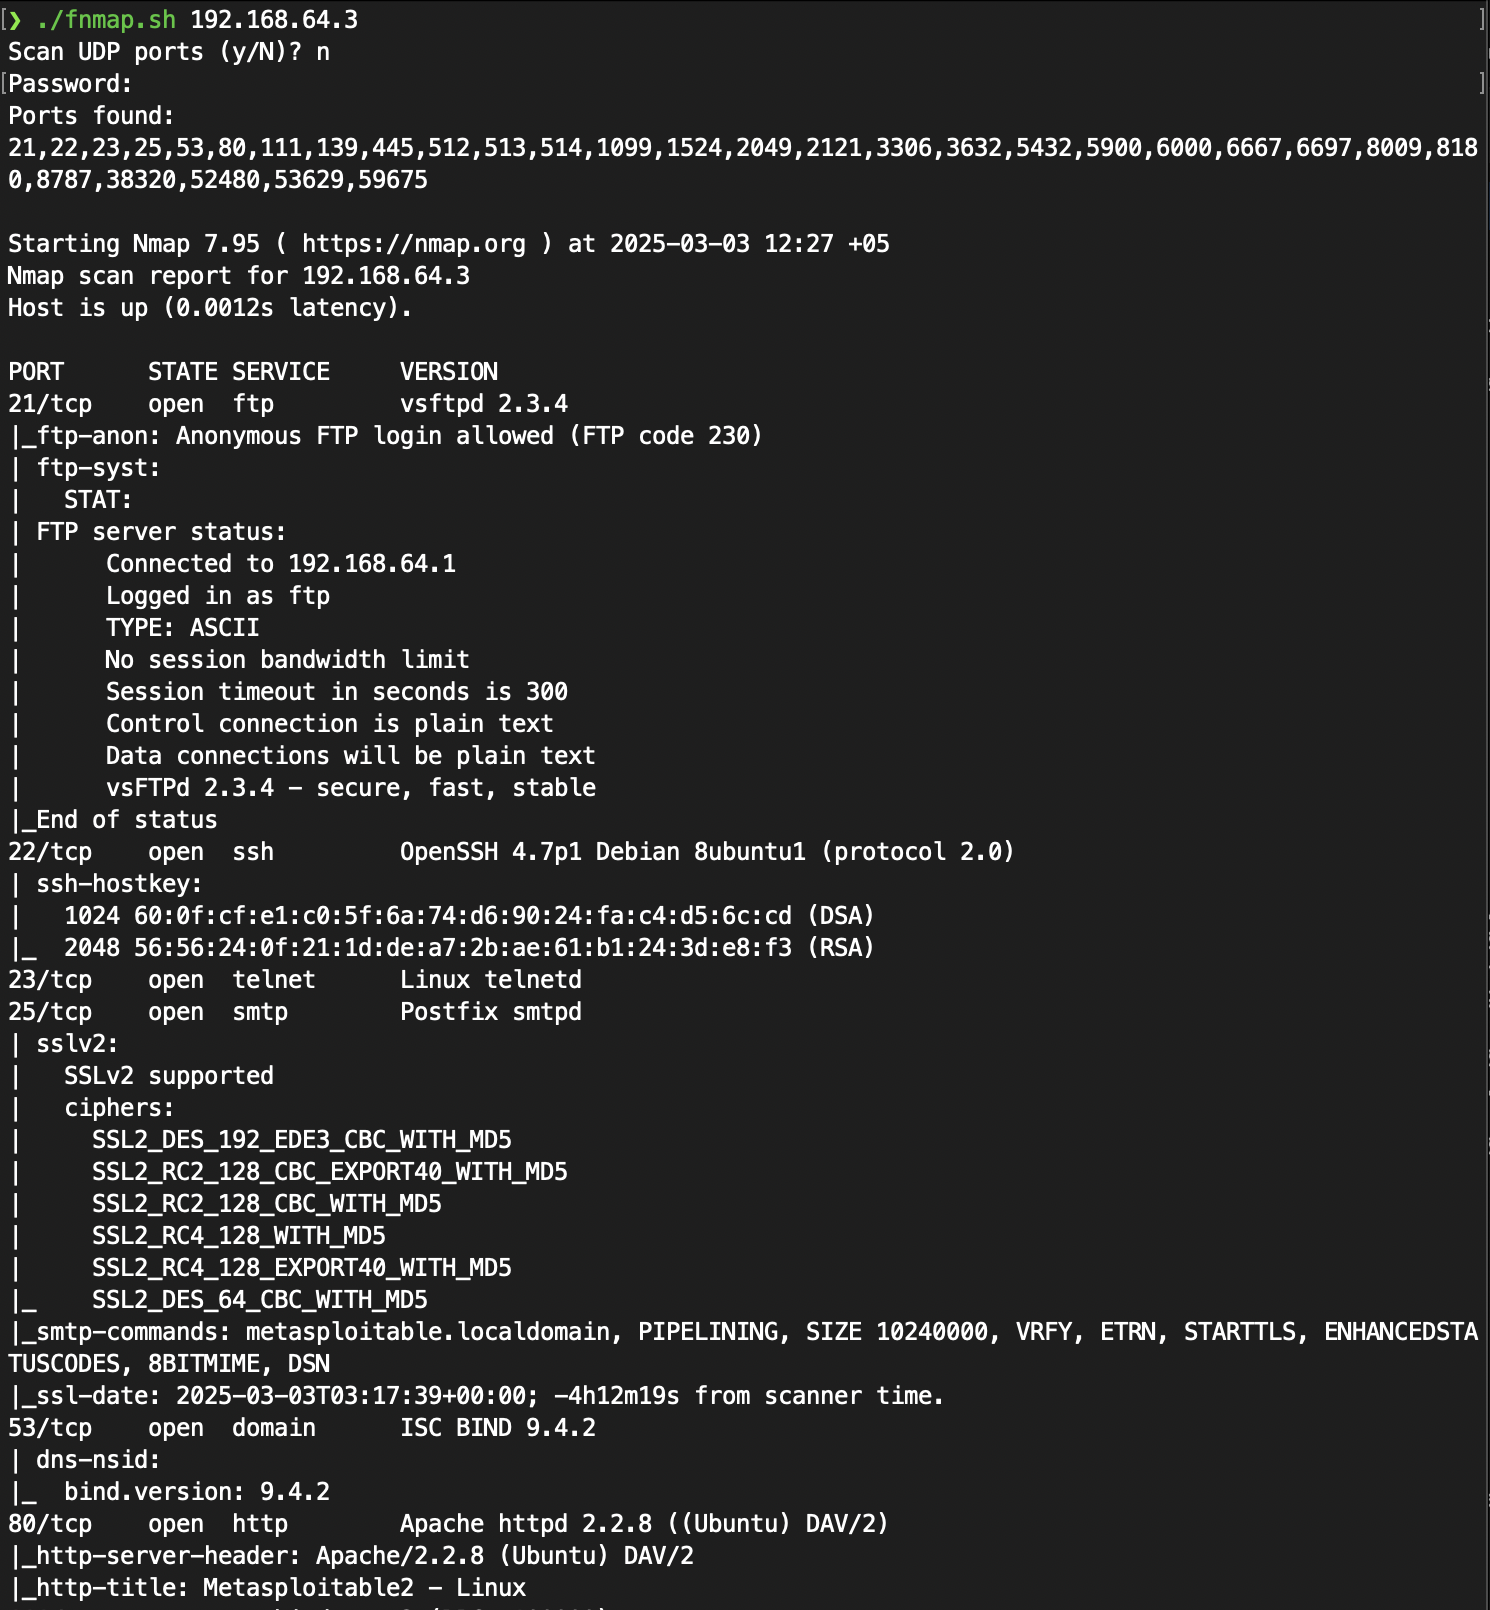
I wrote a script to scan all available ports in TCP and UDP and then rescan them with version detection and common scripts. You can find the full version in my GitHub repository.
1
2
3
4
5
6
7
8
ports=$(sudo nmap -p- $UDP -sS -Pn --min-rate=500 $1 | grep ^[0-9] | cut -d '/' -f 1 | tr '\n' ',' | sed s/,$//)
echo "Ports found:
$ports
"
filename="$1_scan"
sudo mkdir nmap
sudo nmap -p$ports $UDP -sS -T4 -Pn --open -sC -sV \
    -oA "nmap/$filename" $1
Step-by-step network scanning
The more practical task is automate network scanning by dividing it into several steps. At first you may want to identify hosts and a low number of common opened ports in the network. Then, you can go deeper by increasing the number of scanned ports to hundreds or thousand. And the last step will be get a full port scan of the hosts to get the most clear results. This process must be very quickly at the first step and may take some time for the last step.
By the end you will have a full list with identified hosts, ports and services. This method will allow you get fast results to work with and go deeper later.
I’ve found a script which automates the network scanning process by dividing it in 3 steps from quick one to long one. It takes network range and ping scanning as options and starts the scan. You can view the full script in author’s GitHub Gist
1
2
3
nmap $IP $PN --privileged --min-rtt-timeout 50ms --initial-rtt-timeout 300ms --max-retries 2 --host-timeout 15m -g 53 -p T:80,443,25,135,137,139,445,1433,3306,5432,23,21,22,110,111,2049,3389,8080 -sV -sC -oX step1.xml \
&& nmap --privileged --min-hostgroup 100 --max-hostgroup 1000 --max-rtt-timeout 500ms --min-rtt-timeout 50ms --initial-rtt-timeout 300ms --max-retries 2 -g 53 -sU -p T:0-20,24,26-79,81-109,112-134,136,138,140-442,444,446-1432,1434-2048,2050-3305,3307-3388,3390-5431,5433-8079,8081-29999,U:53,111,137,161,162,500,1434,5060,11211 -sV -sC -oX step2.xml --script targets-xml --script-args newtargets,state=up,iX=step1.xml \
&& nmap --privileged --min-hostgroup 100 --max-hostgroup 1000 --max-rtt-timeout 500ms --min-rtt-timeout 50ms --initial-rtt-timeout 300ms --max-retries 2 -sV -g 53 -sU -p T:30000-65535,U:67-69,123,135,138,139,445,514,520,631,1434,1900,4500,5353,49152 -oX step3.xml --script targets-xml --script-args newtargets,state=up,iX=step2.xml
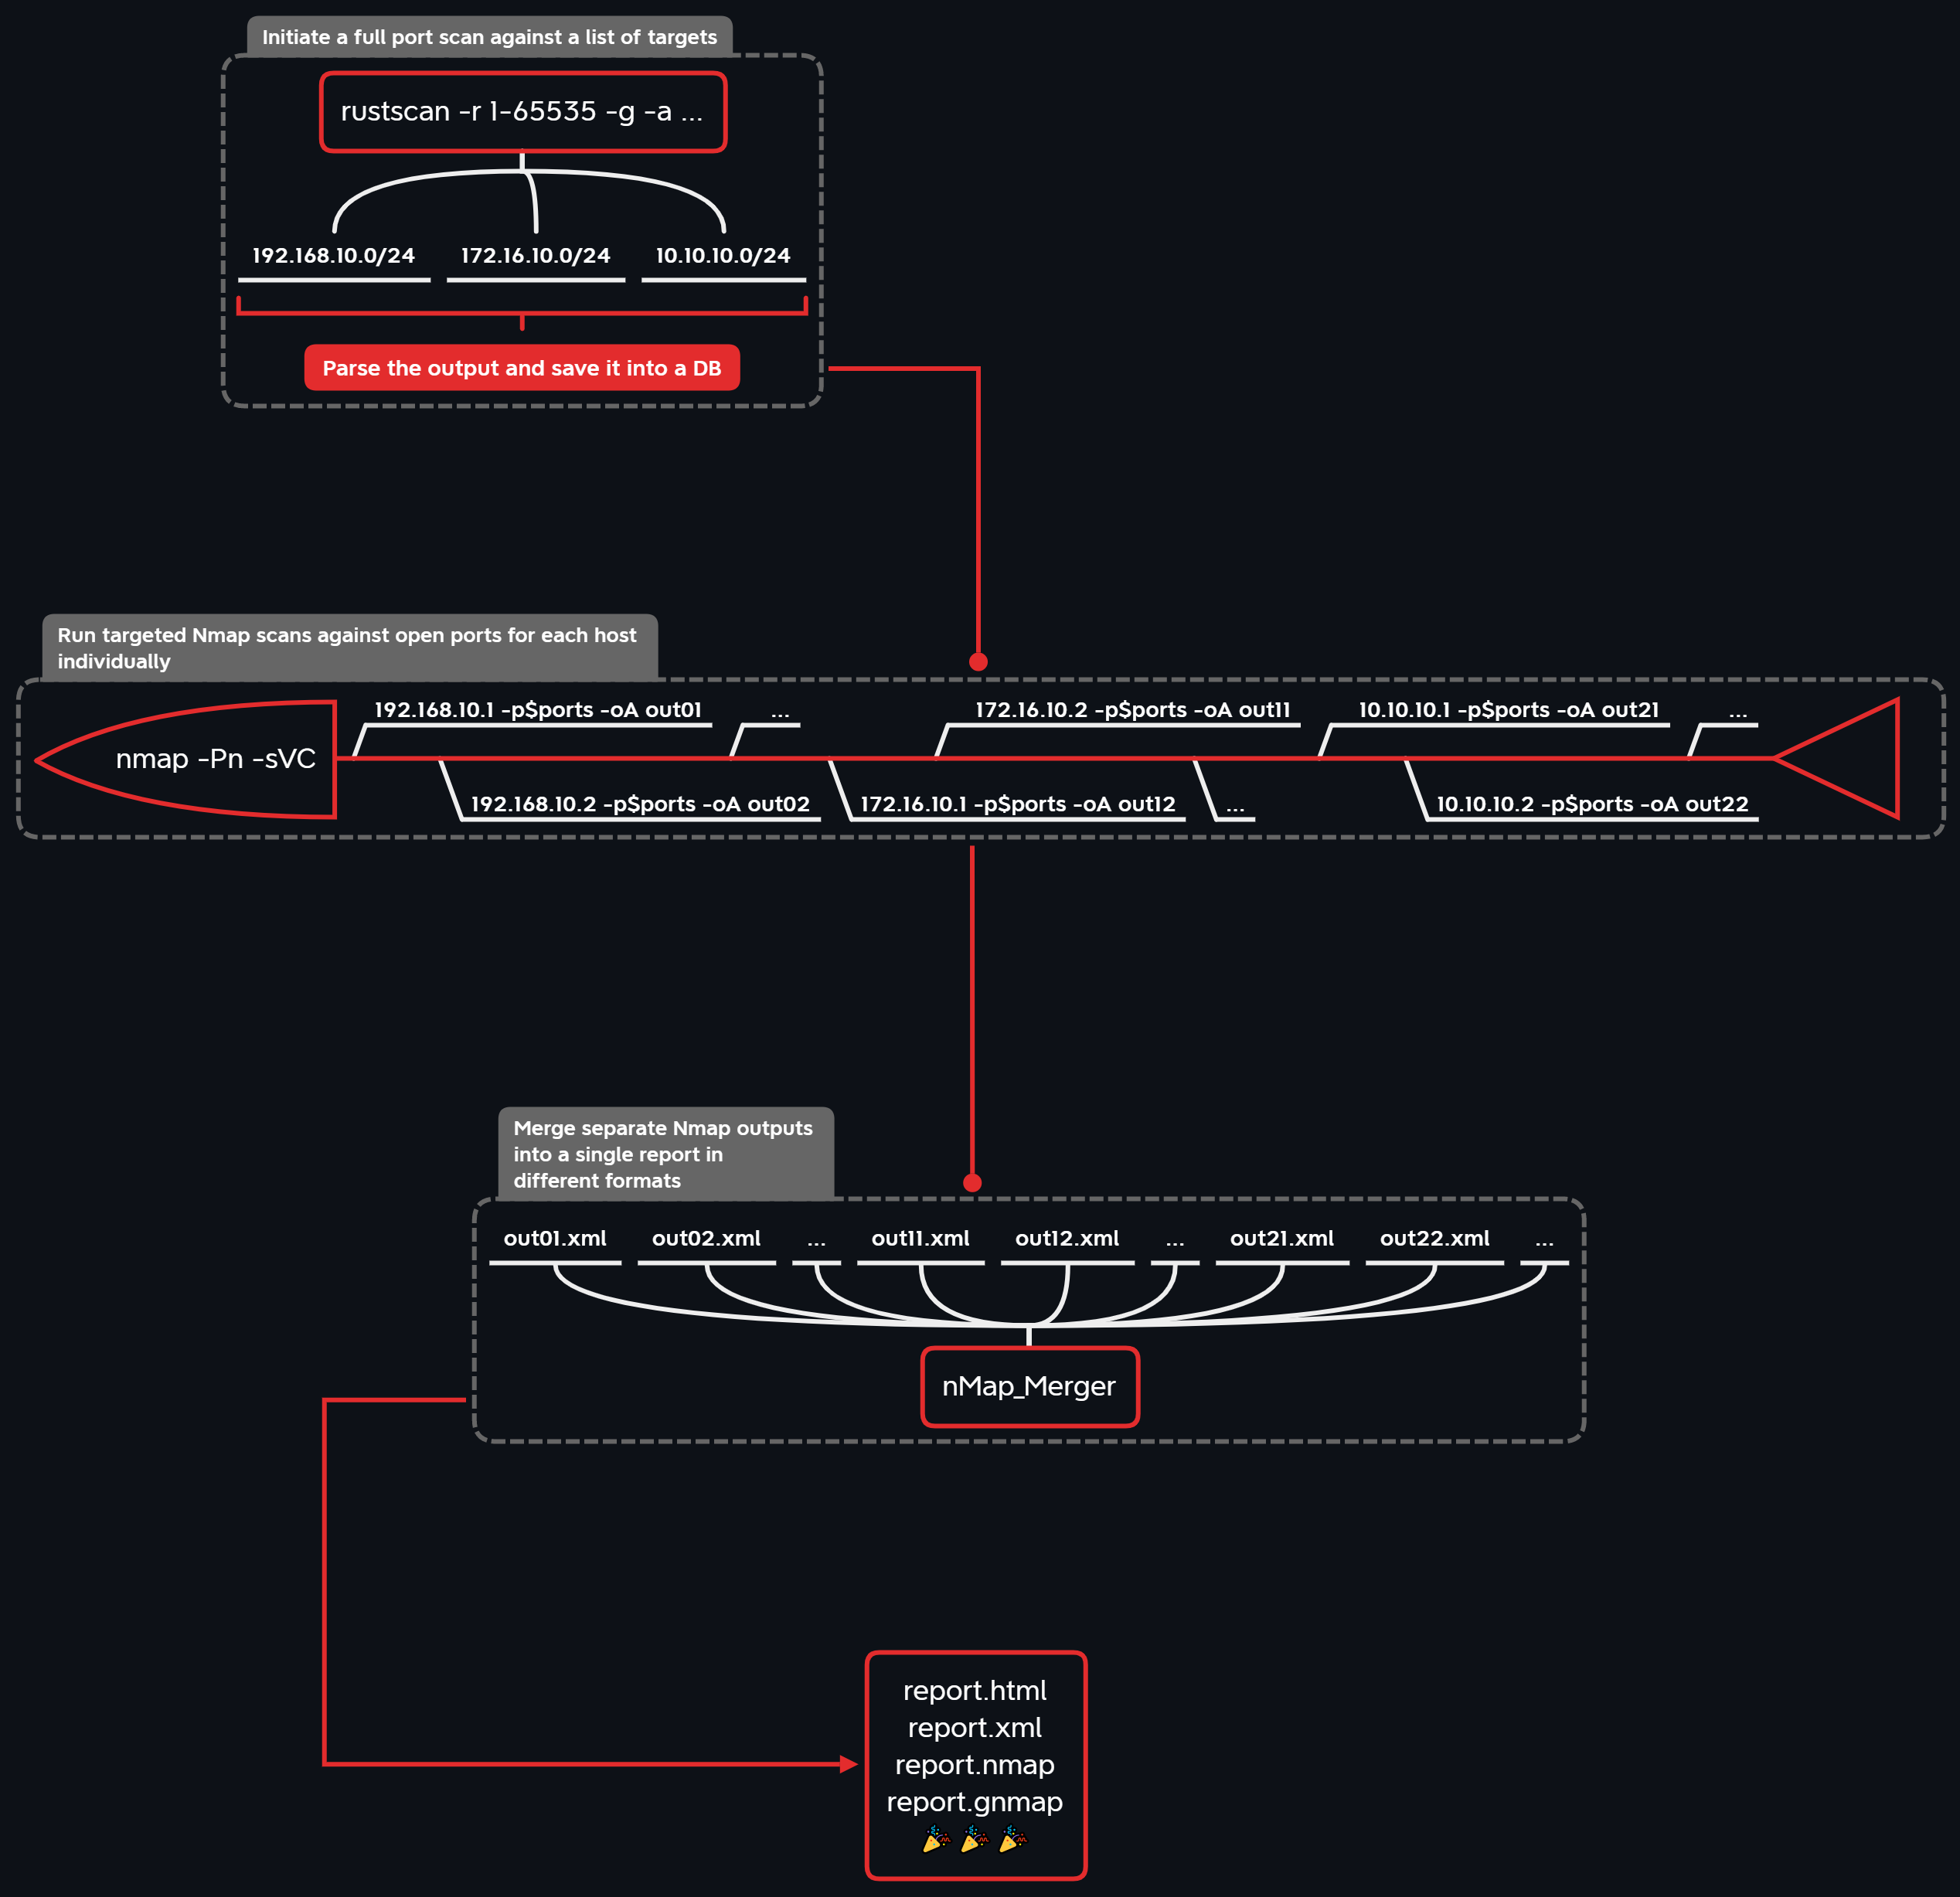
Another worth noting tool is the DivideAndScan. DivideAndScan is used to efficiently automate port scanning routine by splitting it into 3 phases:
- Discover open ports for a bunch of targets.
- Run Nmap individually for each target with version grabbing and NSE actions.
- Merge the results into a single Nmap report (different formats available).
For the 1st phase a *fast port scanner** is intended to be used, whose output is parsed and stored in a single file database. Next, during the 2nd phase individual Nmap scans are launched for each target with its set of open ports (multiprocessing is supported) according to the database data. Finally, in the 3rd phase separate Nmap outputs are merged into a single report in different formats (XML / HTML / simple text / grepable).
The tool supports several scanning tools, for example, the command below shows how to use it with nmap.
1
2
3
4
5
6
7
8
9
# step 1. Filling the DB
# Nmap, -v flag is always required for correct parsing!
das add nmap '-v -n -Pn -e eth0 --min-rate 1000 -T4 -iL hosts.txt -p1-65535 --open'

# step 2. Targeted scanning
das scan -hosts 192.168.1.0/24,10.10.13.37 -oA report1

# step 3. Merging the reports
das report -hosts 192.168.1.0/24,10.10.13.37 -oA report1
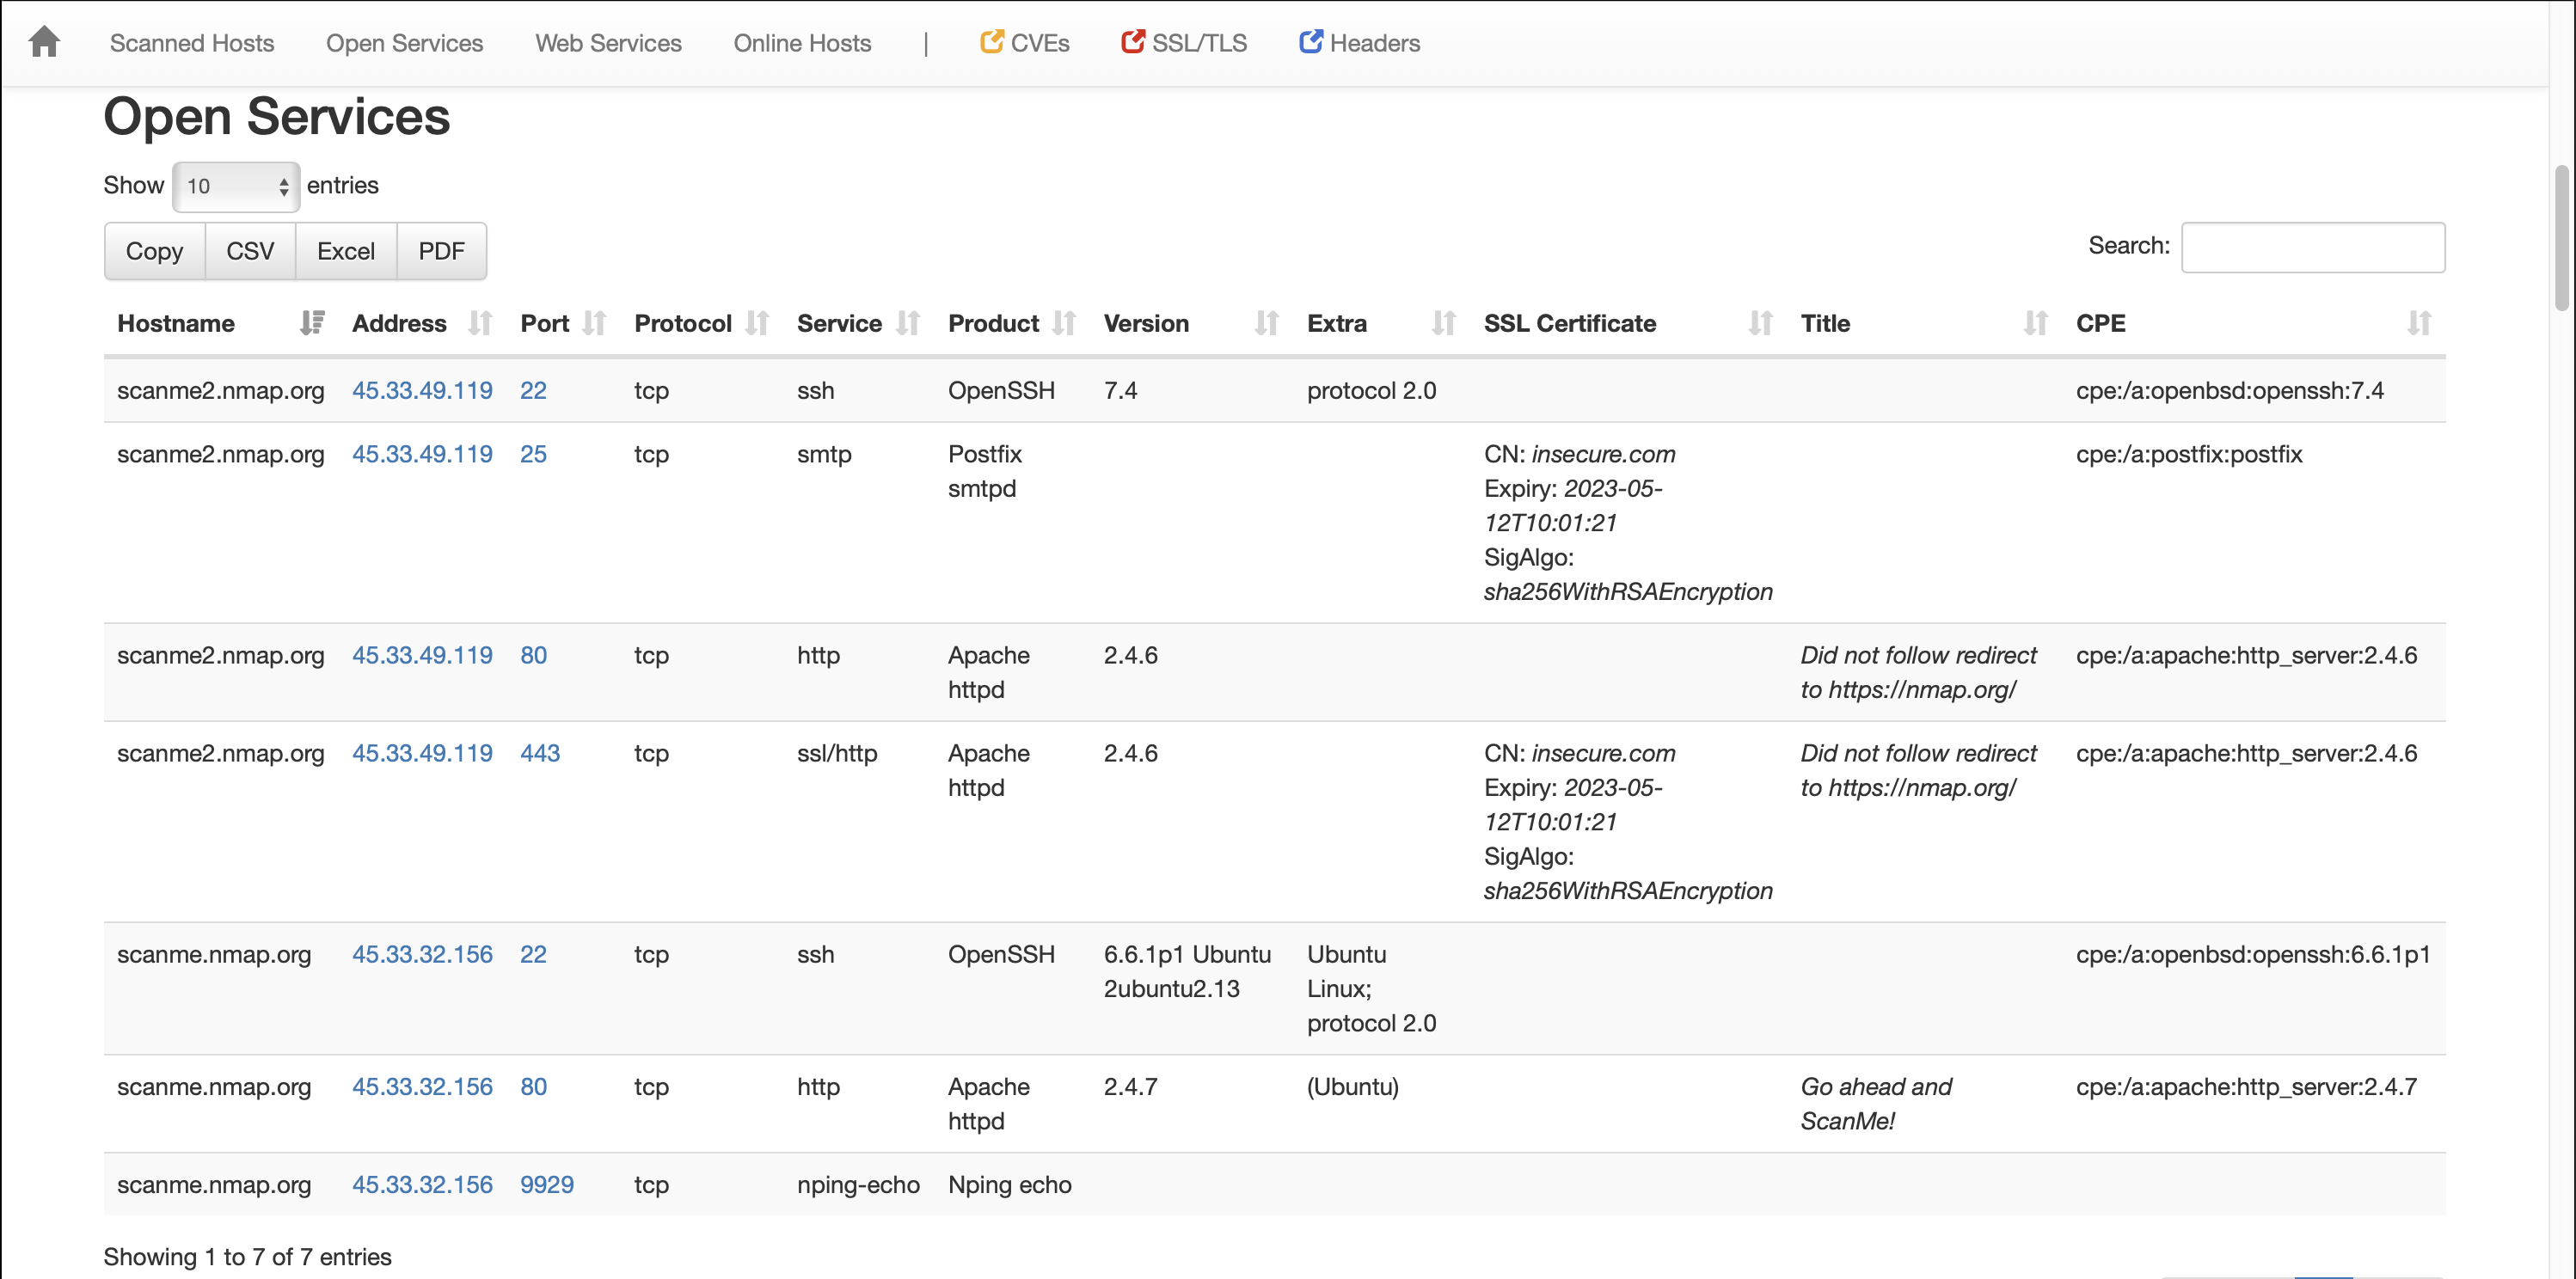
After the scan is done, you will get the merged version of the report. You can view the example result report below:
Visualize the output
Nmap scan to formatted tables
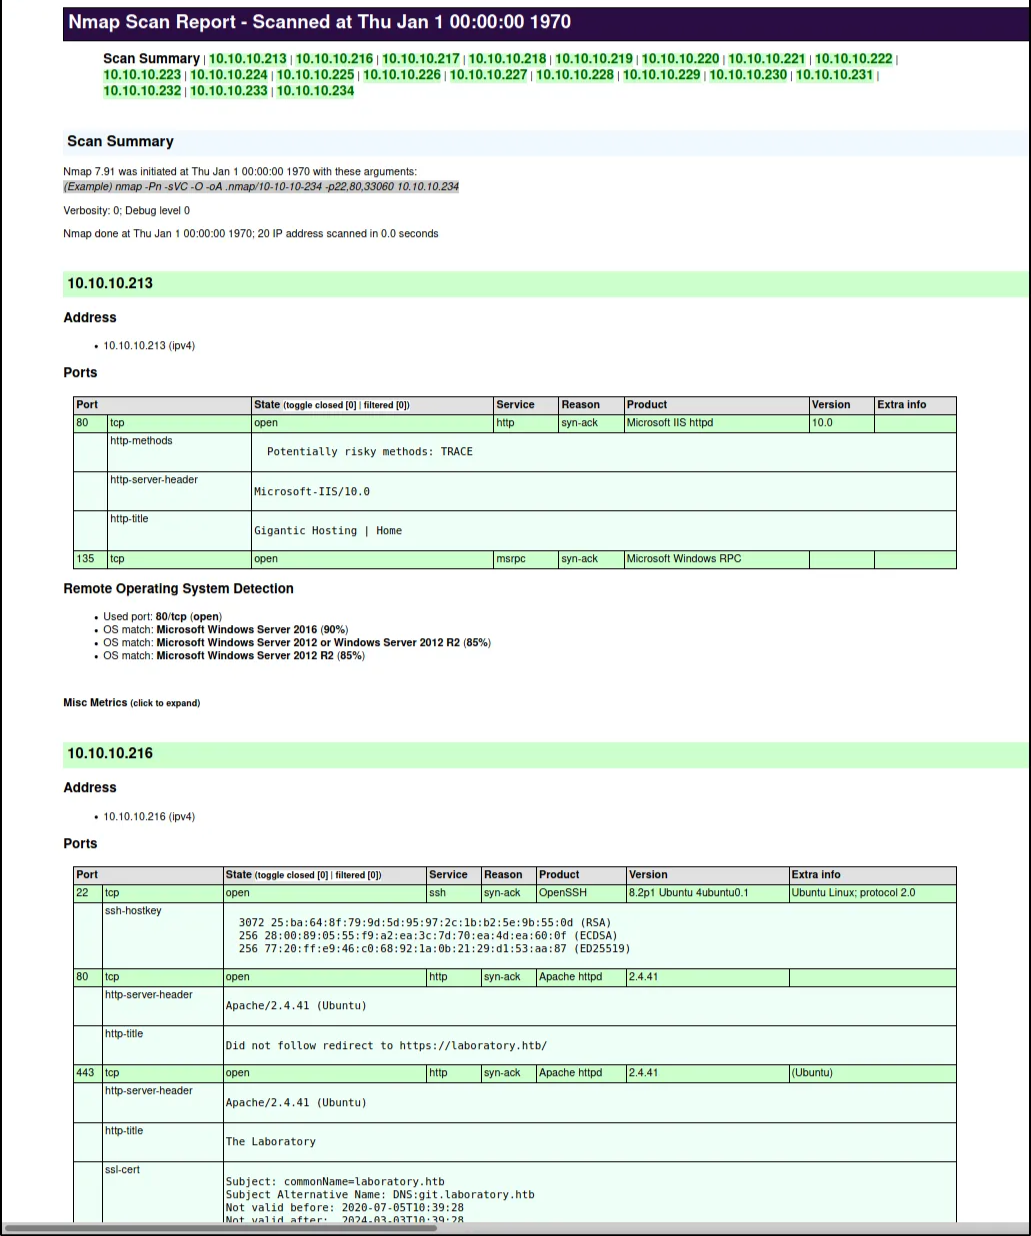
In case of big network scanning it can be hard to process nmap text or greppable results, because they are designed to view in terminal. In my opinion, the most effective way to view scan results is to view the tables. We can leverage an XML formatted nmap output to format the results in the way we want.
We can do that with nmap-bootstrap-xls library. This is an sample formatting file to convert our nmap scan results in pretty-formatted HTML file.
In my opinion more reliable way to do that is to download sample nmap-bootstrap.xsl file and use it locally with xsltproc, when the scan is done. But it is possible to pass the sample URL to nmap directly to get the output with the scan results.
1
2
3
4
5
# process results locally
xsltproc -o commonports.html nmap-bootstrap.xsl commonports.xml

# process results right in nmap
nmap -sS -T4 -A -sC -oA scanme --stylesheet https://raw.githubusercontent.com/honze-net/nmap-bootstrap-xsl/master/nmap-bootstrap.xsl scanme.nmap.org scanme2.nmap.org
You can view an example HTML report for that tool in the author’s example report.
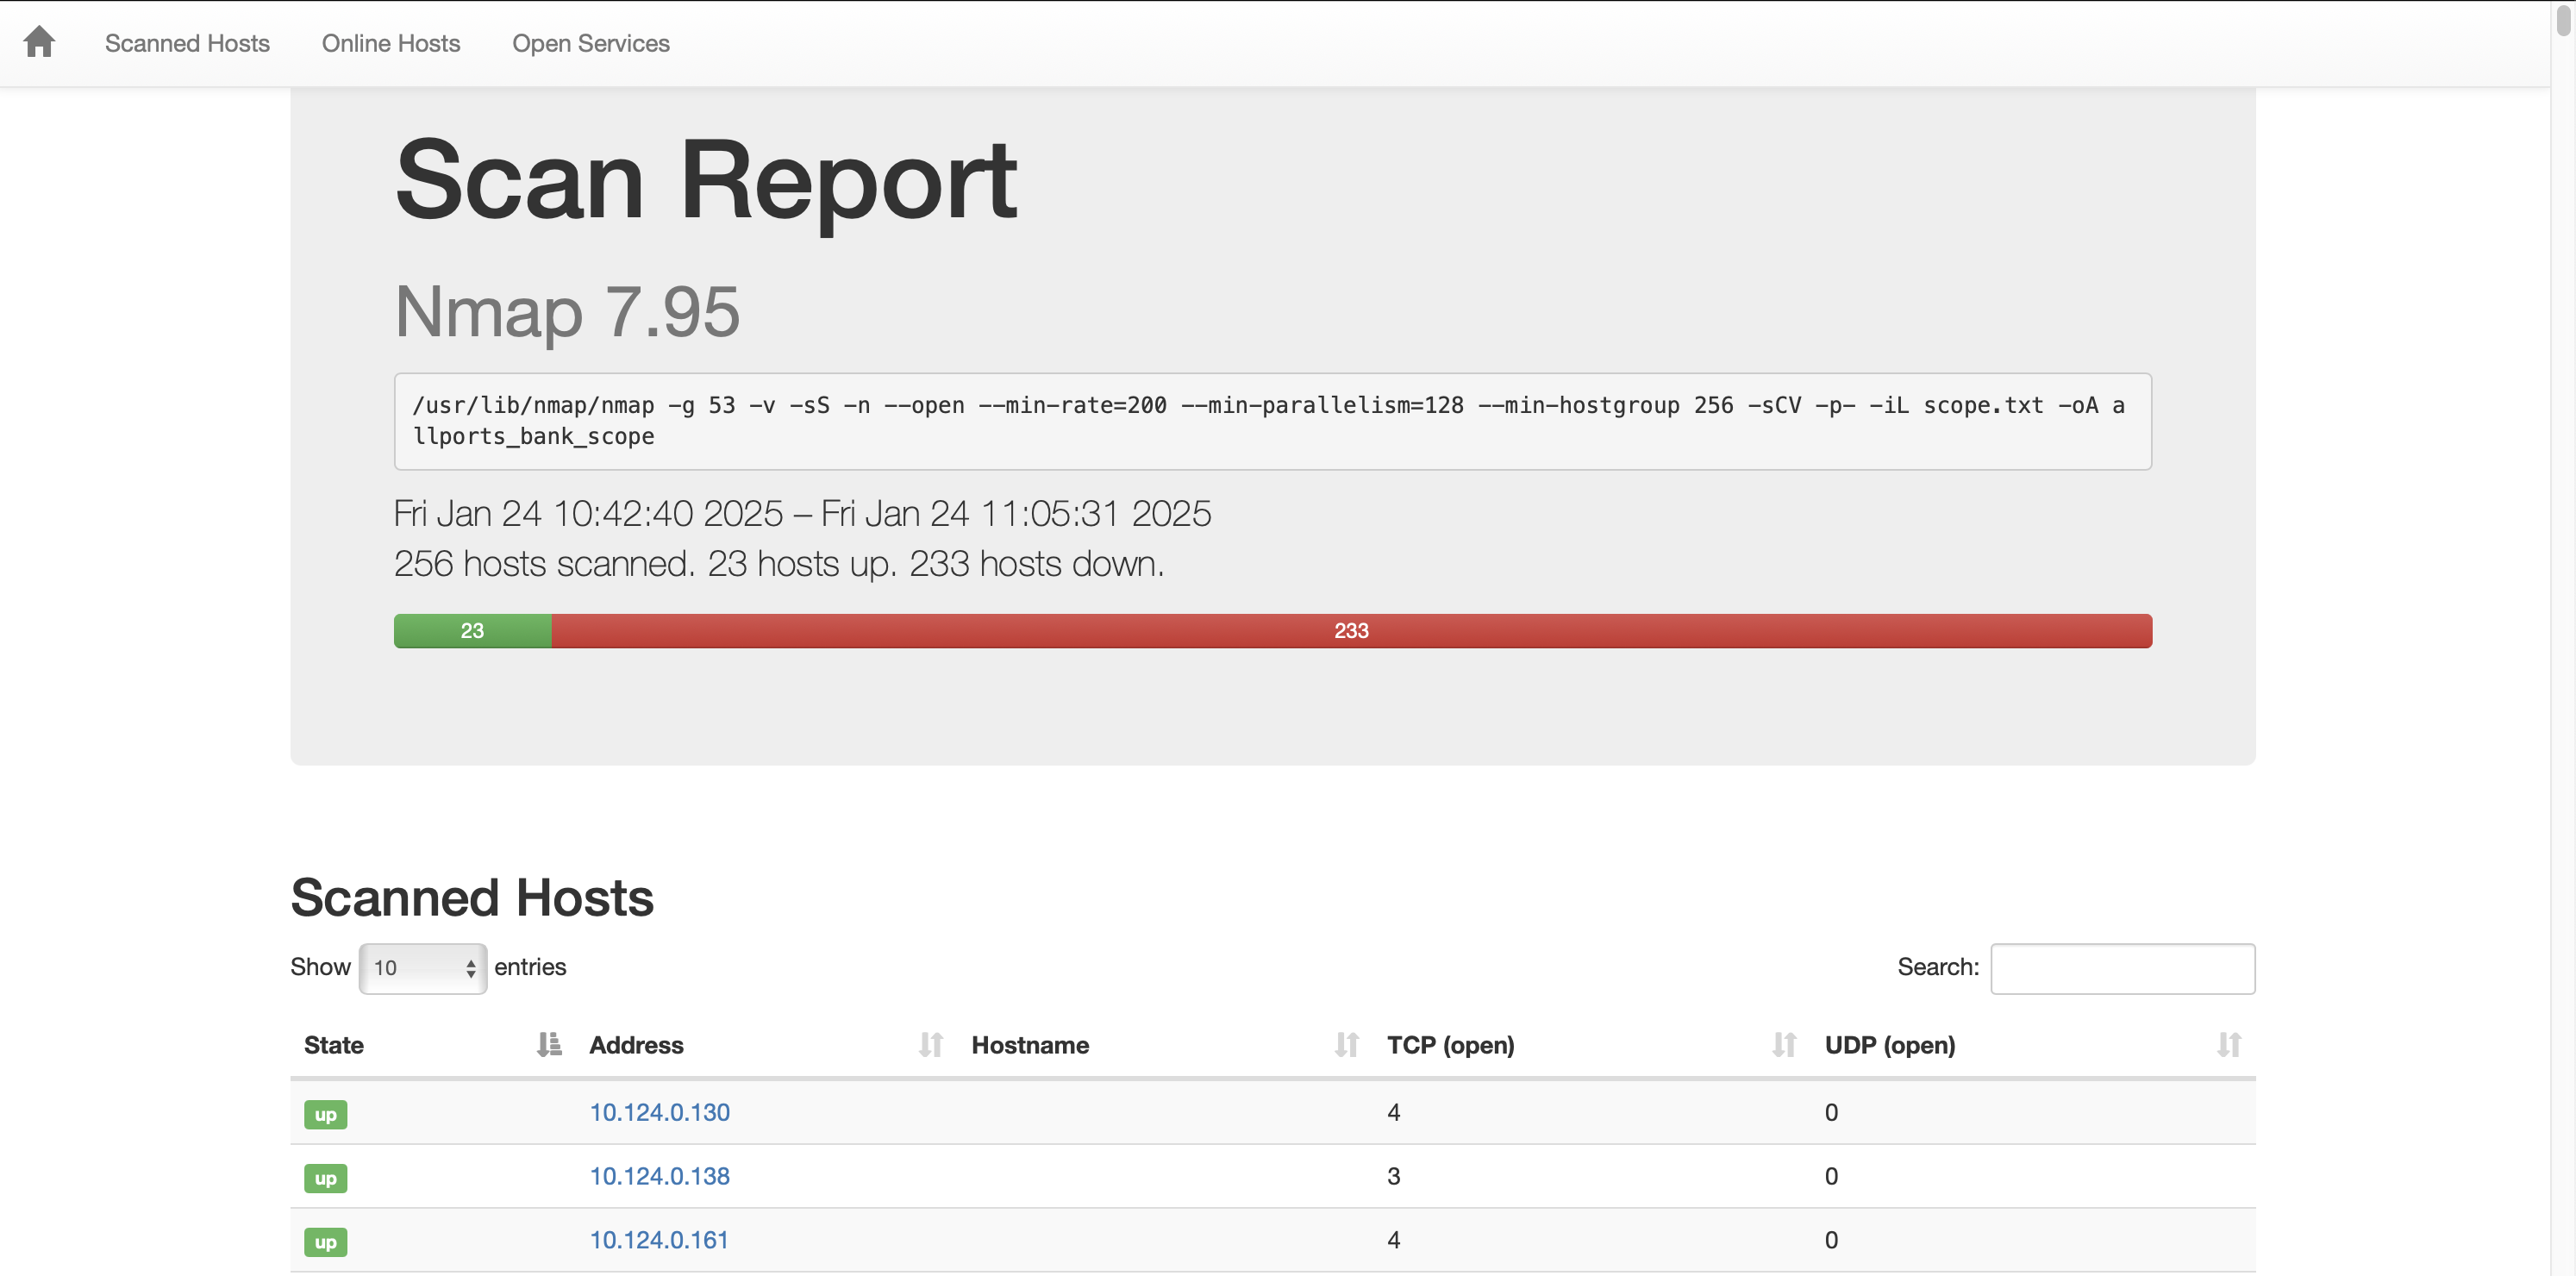
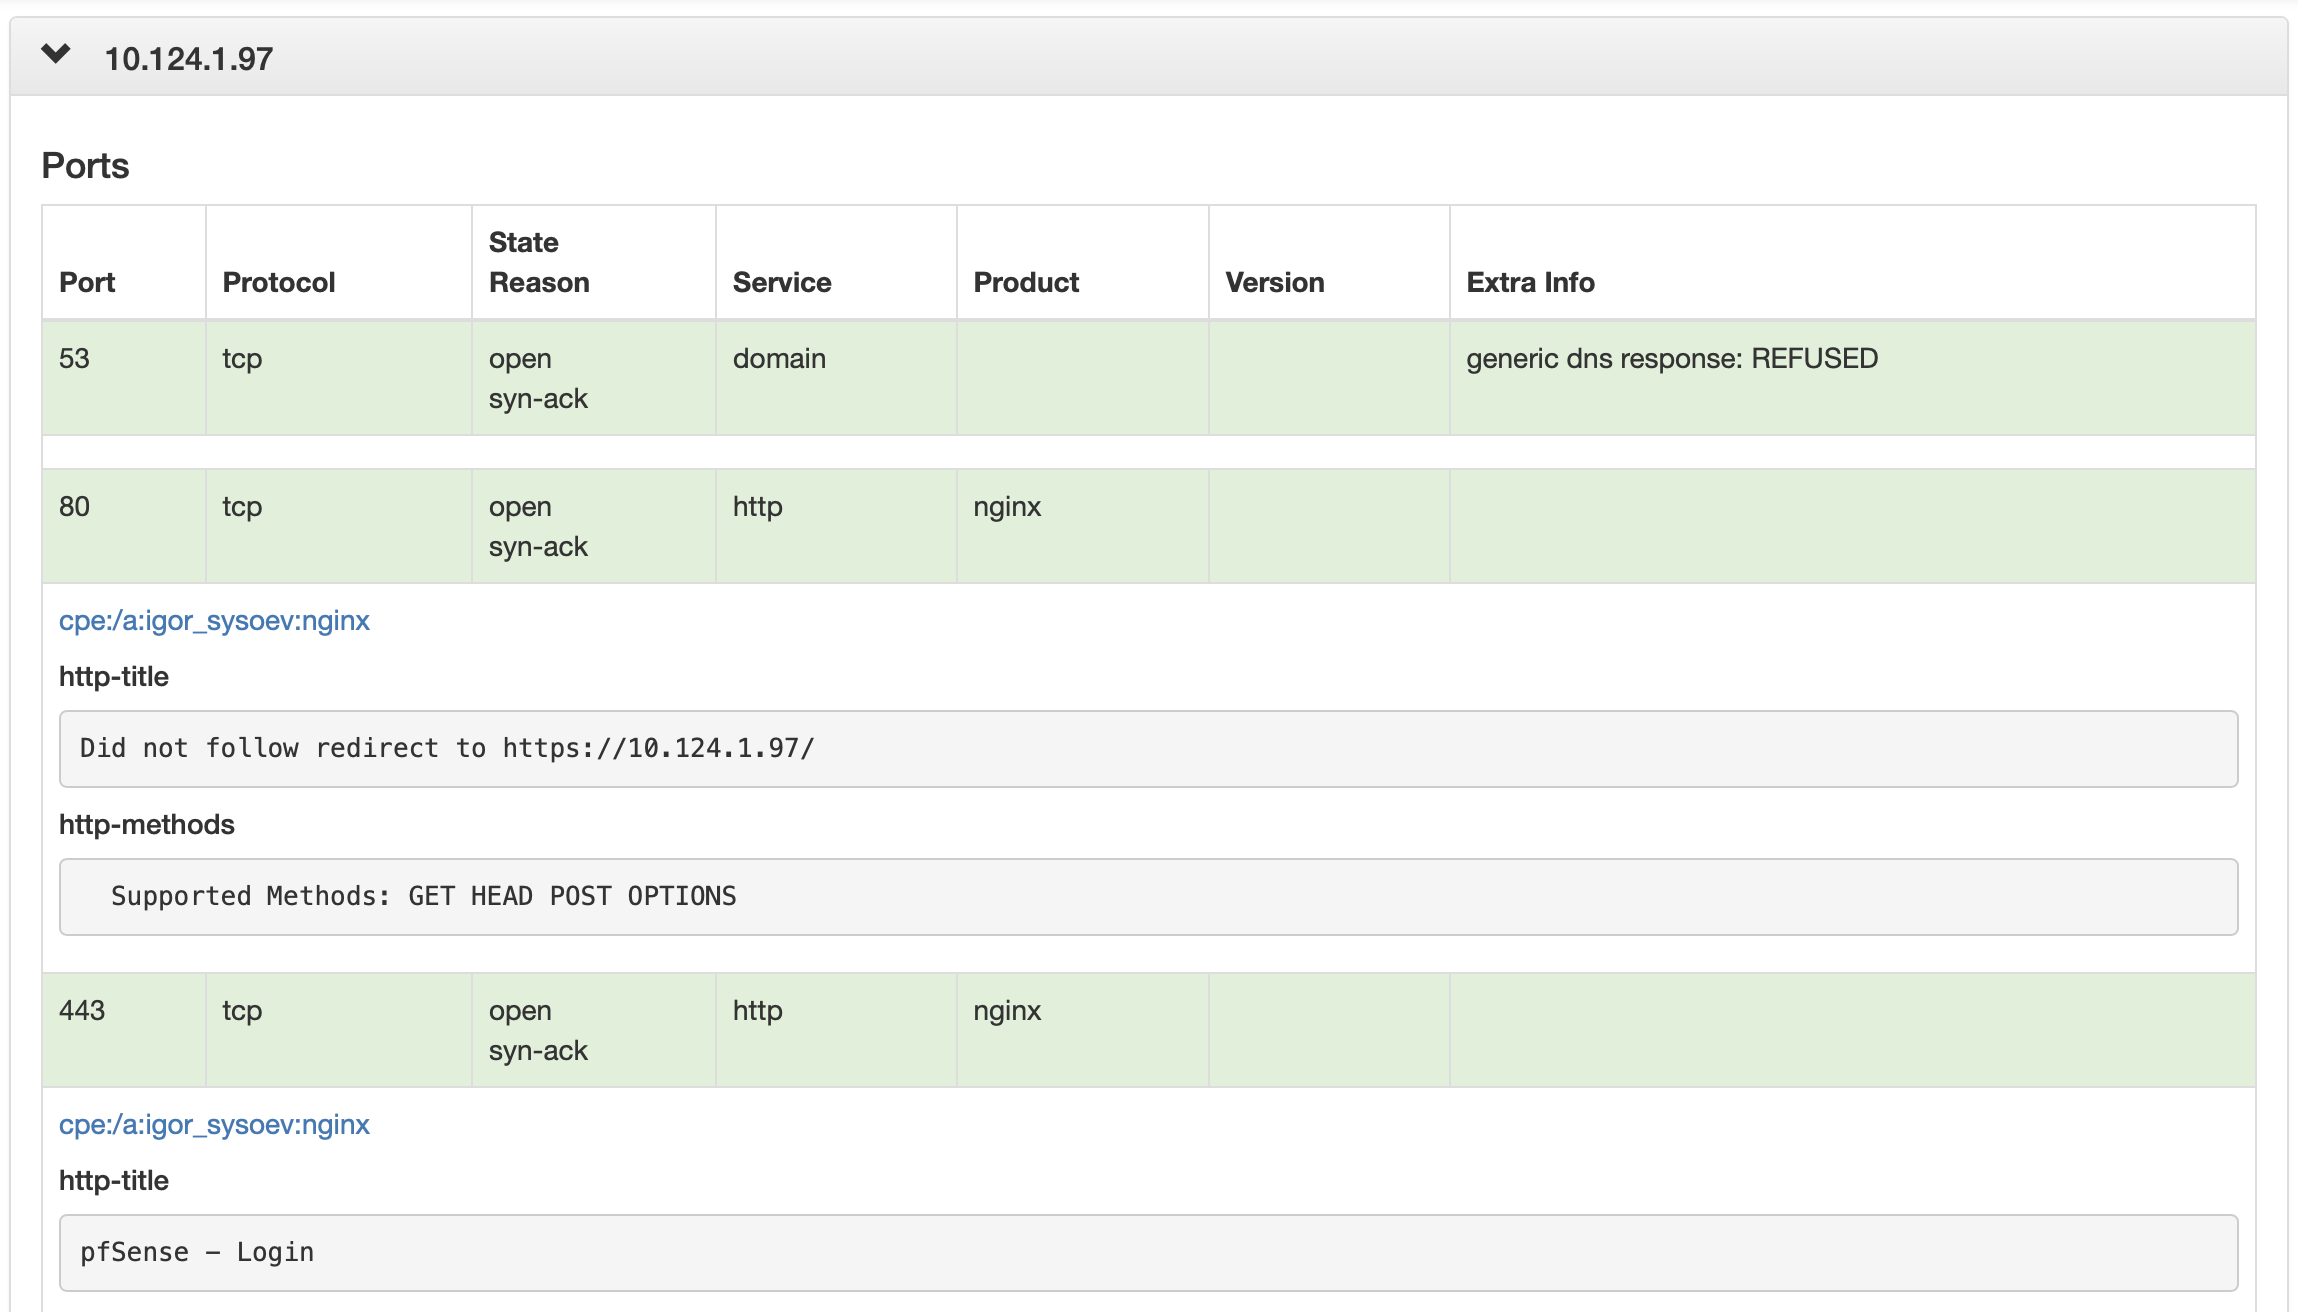
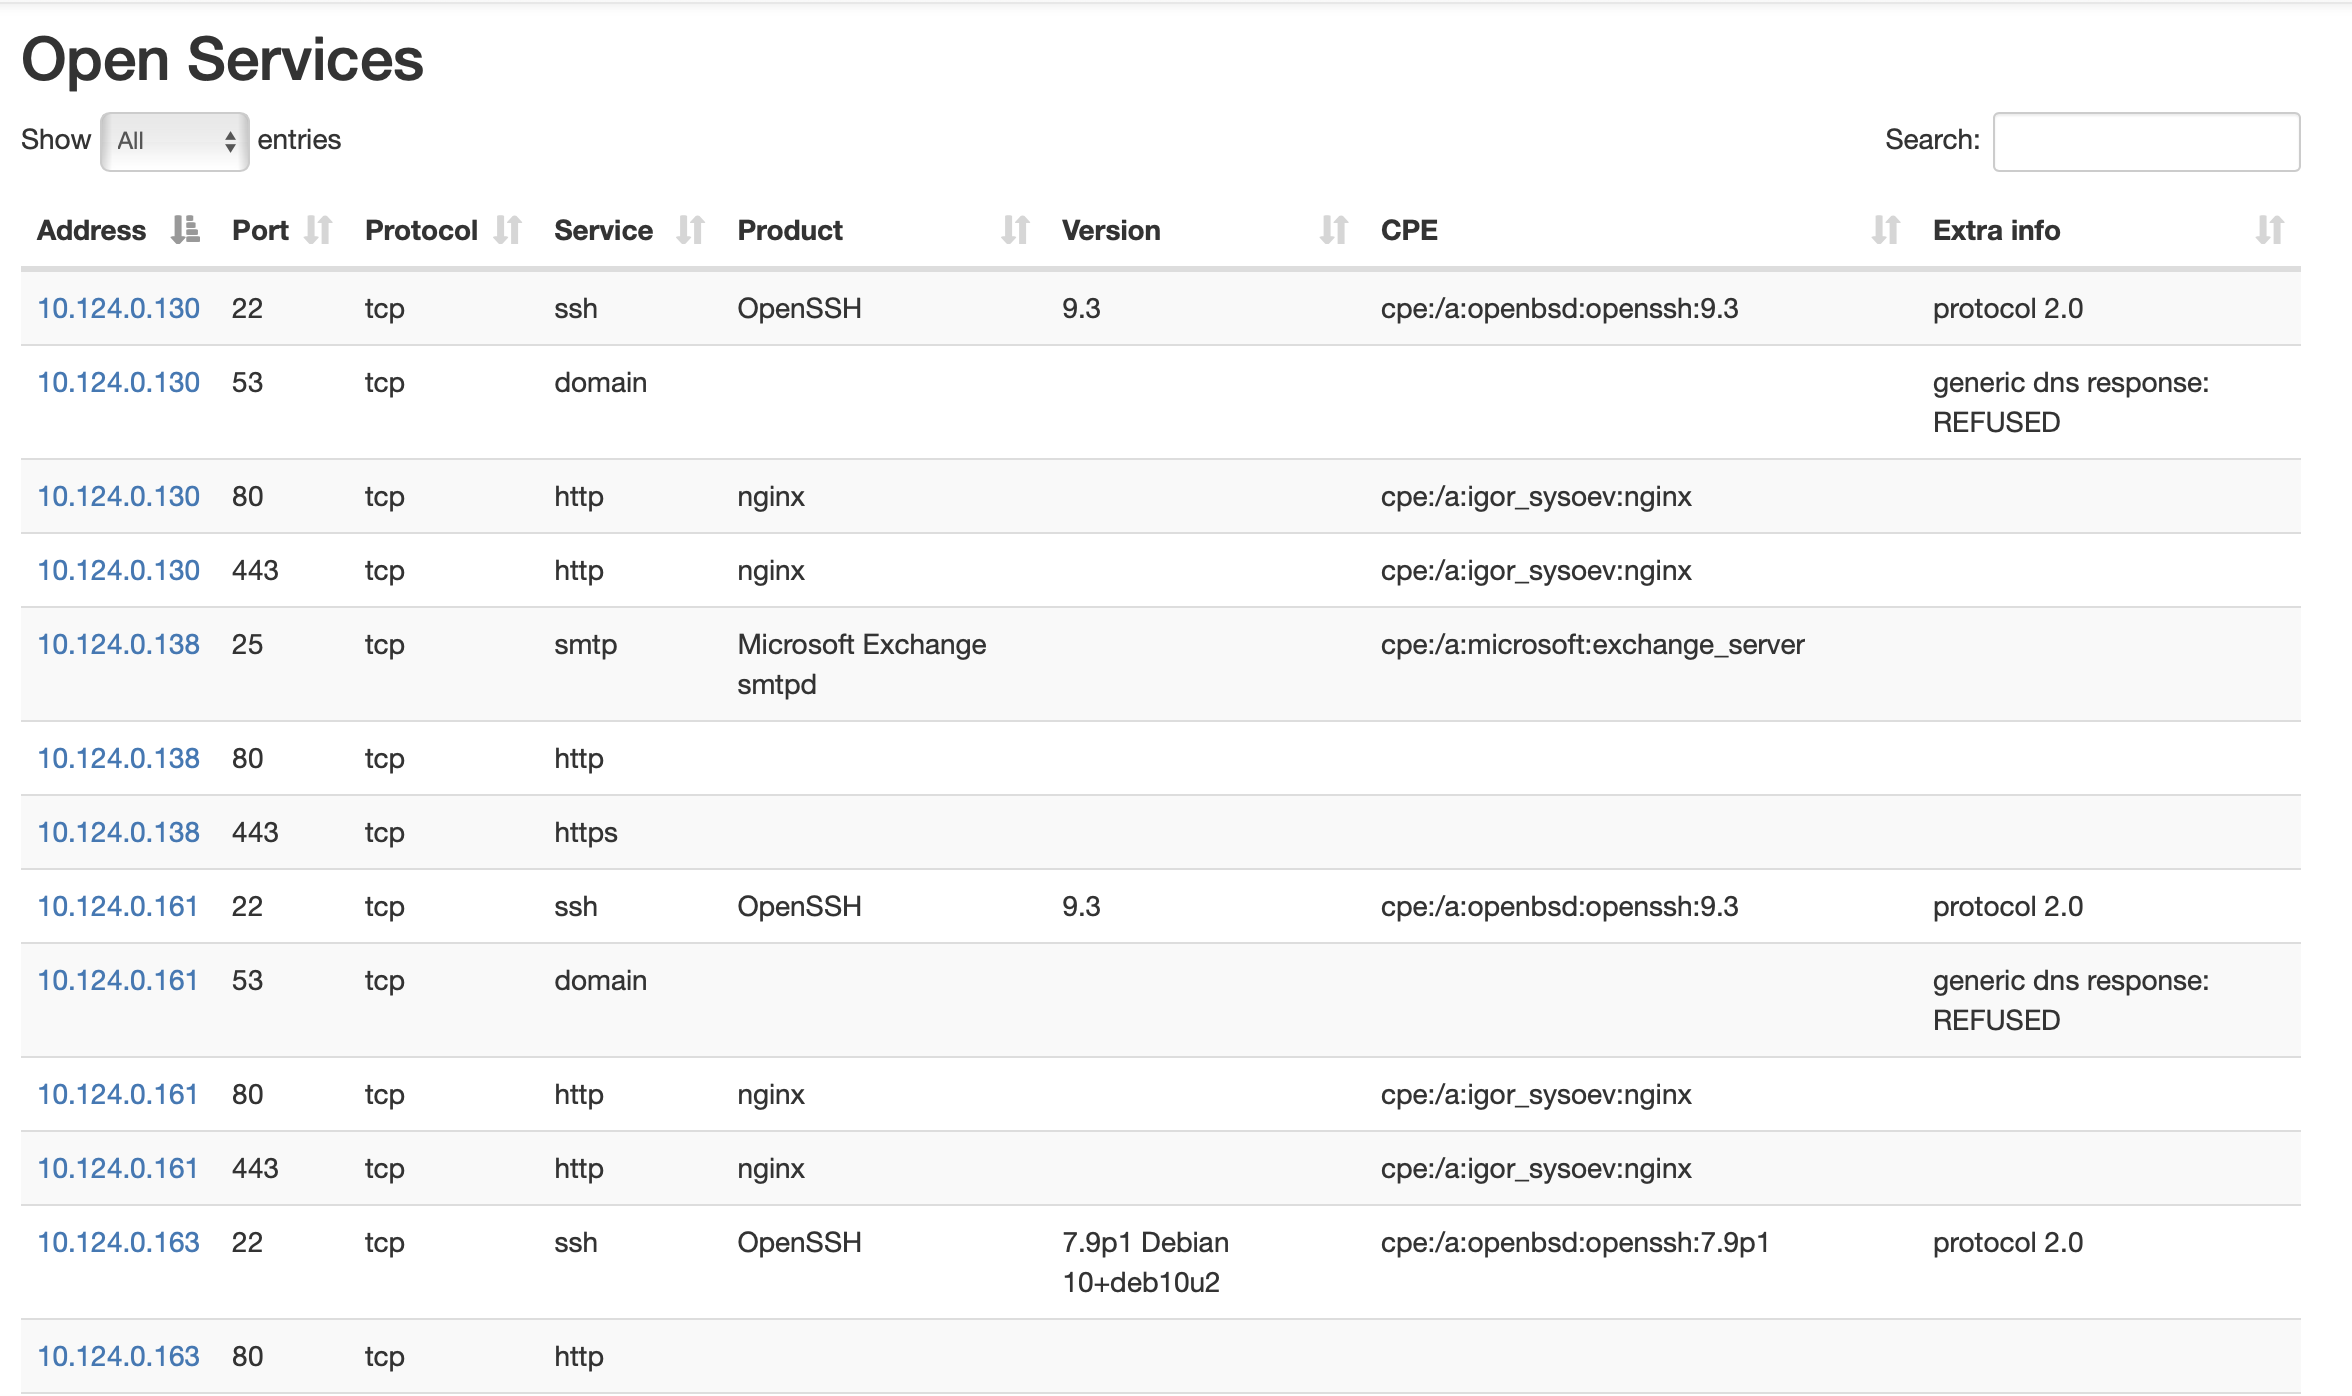
The original tool is enough, there is a more cool version - upgraded nmap-bootstrap-xsl. It provides more features like export functionality in CSV, Excel and PDF, keyword highlighting and detached http-title and ssl-cert fields.
You can check an example HTML report for that new tool in author’s examlple report.
This pretty formatting is possible because of structured XML output of nmap. You can even write your our programmatic nmap parser. For example, there is a go-nmap library for parsing nmaps XML output in Golang.
Web services with screenshots
A lot of available network services now are a web services. They can be identified just by opening them in the browser. In case of web applications, at first we want to focus on most likely vulnerable web applications, like self-coded or vulnerable versions. So we have to open all of the applications to identify, filter and group targets.
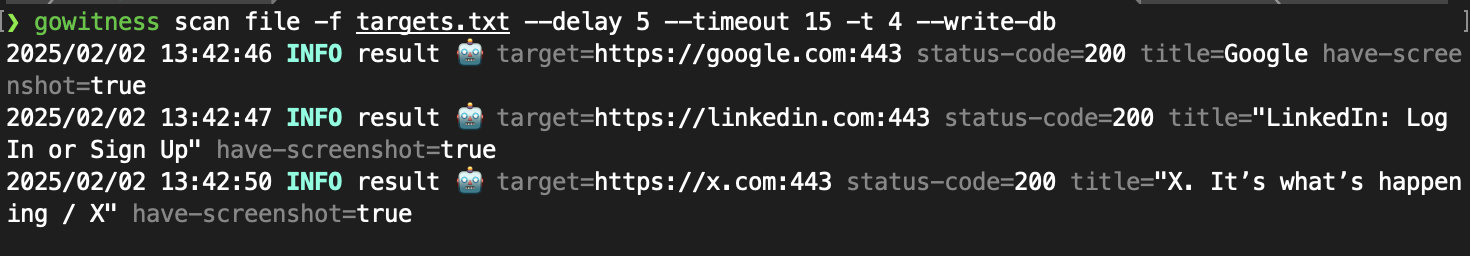
For that task we can use gowitness tool. gowitness is a website screenshot utility written in Golang, that uses Chrome Headless to generate screenshots of web interfaces using the command line, with a handy report viewer to process results.
To start we need a target URL or a list or URLs. It is possible to configure request delay, timeout and threads to increase performance or stealth. This commands below will create gowitness.sqlite3 database and screenshots directory. These are used in the report server to view the results interactively.
1
2
3
gowitness scan single --url "https://sensepost.com" --write-db

gowitness scan file -f targets.txt --delay 5 --timeout 15 -t 4 --write-db
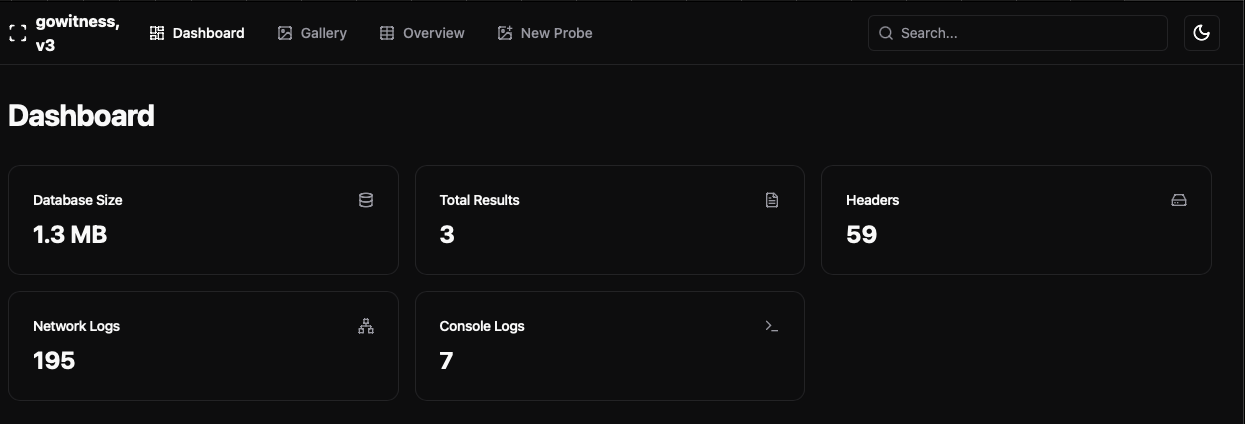
To view the results we can use built-in report server. It will parse the database and screenshots in current directory and show them in pretty formatted web service.
1
gowitness report server
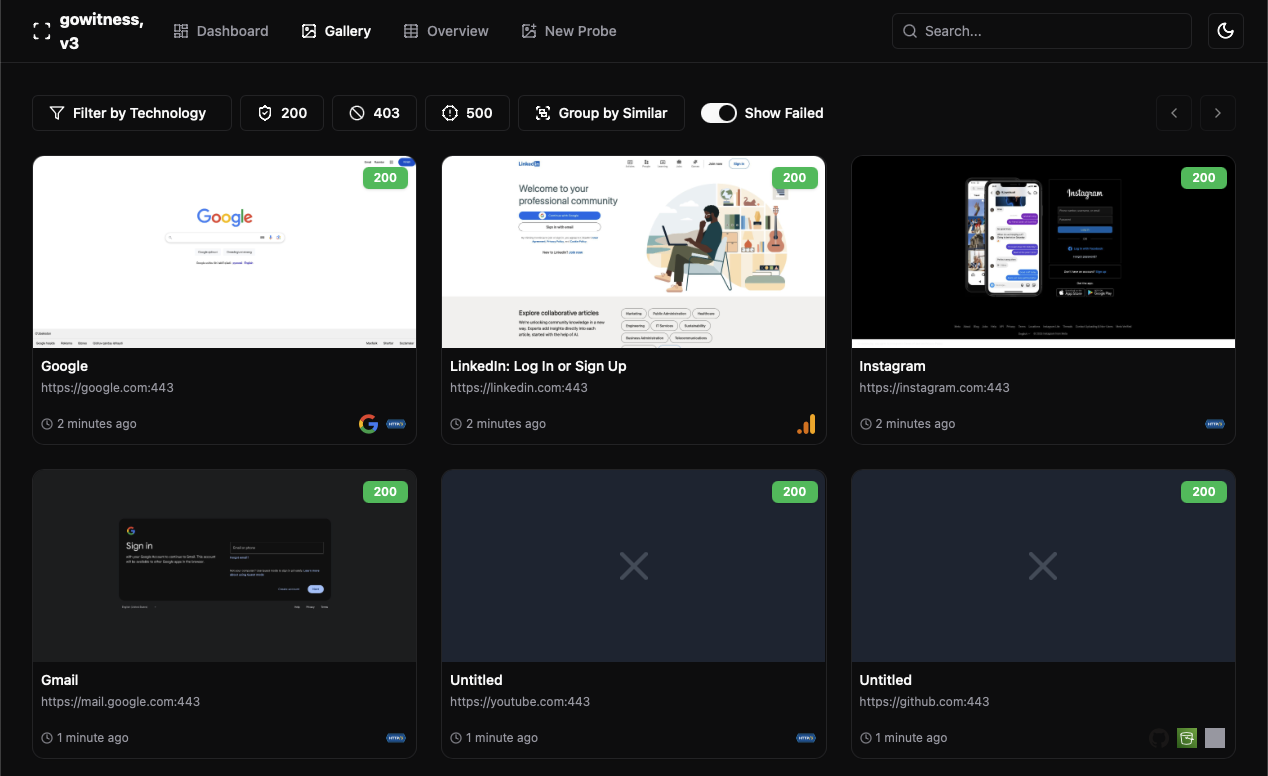
On main page we can see the dashboard with overview on the scanning results. But the most interesting part for us is Gallery section. There we can see the screenshots of scanned web services. We can filter them by status code and group by similar responses to increase the identification.
Resources
Conclusion
In this post we’ve reviewed defense evasion techniques in case of scanning big networks. Also, we’ve found several ways to automate basic tasks and get a pretty output of our scanning.
In next part of these blog post we will review some methods to identify networks, hosts, ports and services in internal networks without performing a scan entirely. Or almost entirely.
Thank you for reading, I hope it was useful for you ❤️